Whole-life comparison
Private AI server five-year TCO calculator.
A server does not become cheaper because somebody divides its price by users. Compare the whole service.
Five-year difference
£0
- Owned-capacity TCO£0
- Hosted-seat total£0
- Owned equivalent per month£0
Not a quality-equivalence claim. Excludes implementation common to both routes, tax relief and speculative spare-capacity income.
Calculation record
See what sits behind the result.
The controls are deliberately editable. Record the values used, the date and the source before relying on an output in a buying decision.
Method
- Owned TCO = purchase + finance + five years of energy, support and facility cost − supported residual value.
- Hosted total = paid users × annual seat cost × five years.
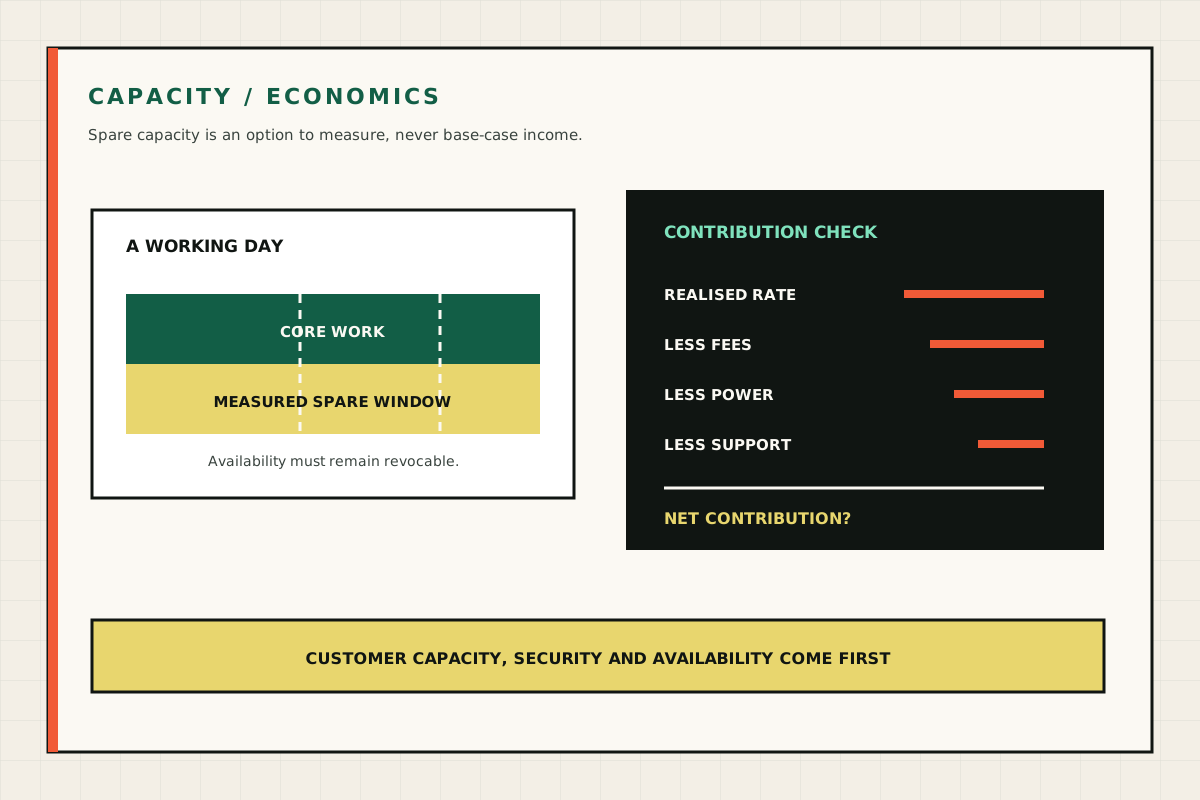
- The comparison deliberately excludes tax relief and spare-capacity income from the base case.
Worked reading
- The defaults compare a £27,500 reference system plus £4,000 annual operating cost with 25 hosted seats.
- A cash difference does not establish quality or feature equivalence.
- Run a light-use case, a measured central case and a higher-cost downside case.
Do not infer
- Hosted seats include a managed product and current provider model access.
- Owned capacity needs technical ownership, accepted local models and a site.
- Exchange rates, provider features, hardware prices and support needs can change.
Read the comparison carefully
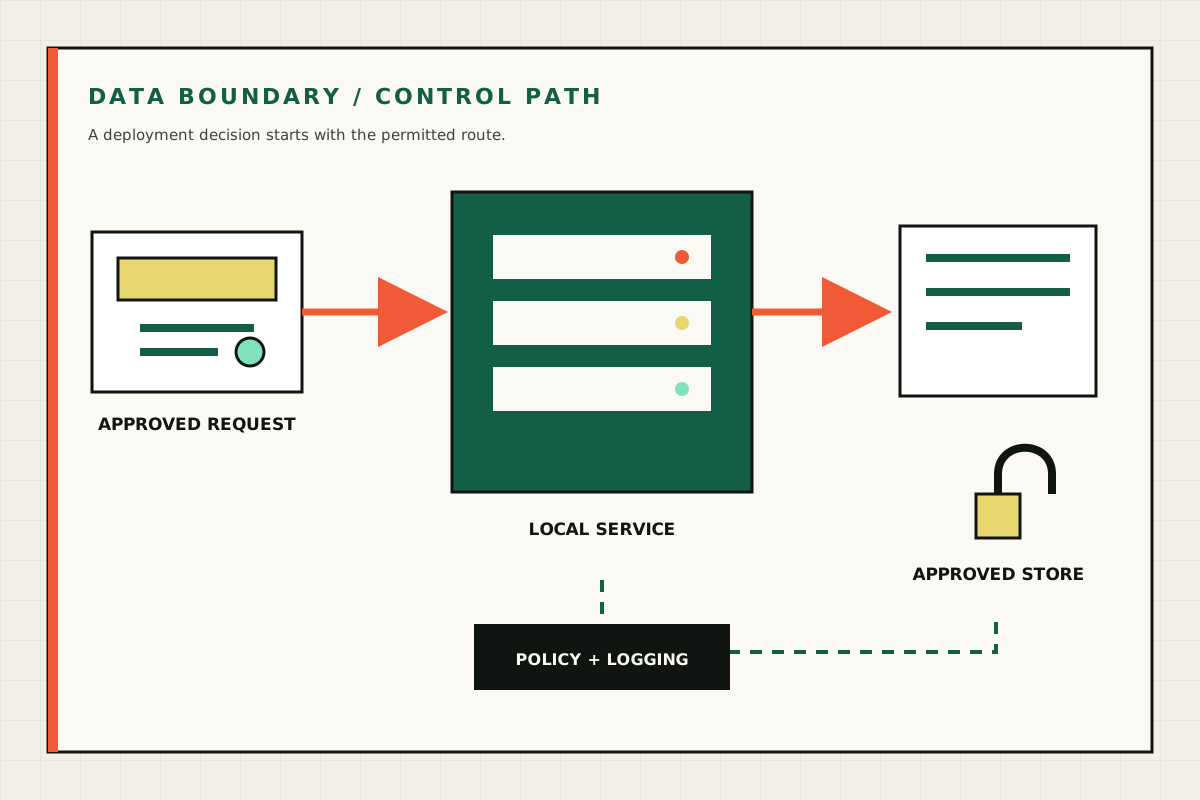
Hosted seats include a managed product and current model access. Owned capacity needs an operator and may use a different model. Control, offline operation and local integration can have value even without a pure cash crossover; name that value rather than hiding it in savings.
Commercial value starts with a complete cost boundary.
Include installation, energy, support, finance and adviser-confirmed tax treatment. Potential spare-capacity income should remain optional upside.